Compiled XPE code executes very little debug specific code. This code is not enough in itself to allow the XPE code to be interactively debugged. To achive this, additional debug code must be added to the compiled XPE code. This is done using the optimise_trace statement. The optimise_notrace statement causes XPE code to be compiled without debug code. These statements can be placed anywhere a normal XPE statement is allowed, however to have a global effect they are normally placed in the xpe.ini file.
The stop statement causes the currently executing XPE code to be stopped and executed in trace mode. The debug dialog is used to interactively debug XPE code that is executing in trace mode.
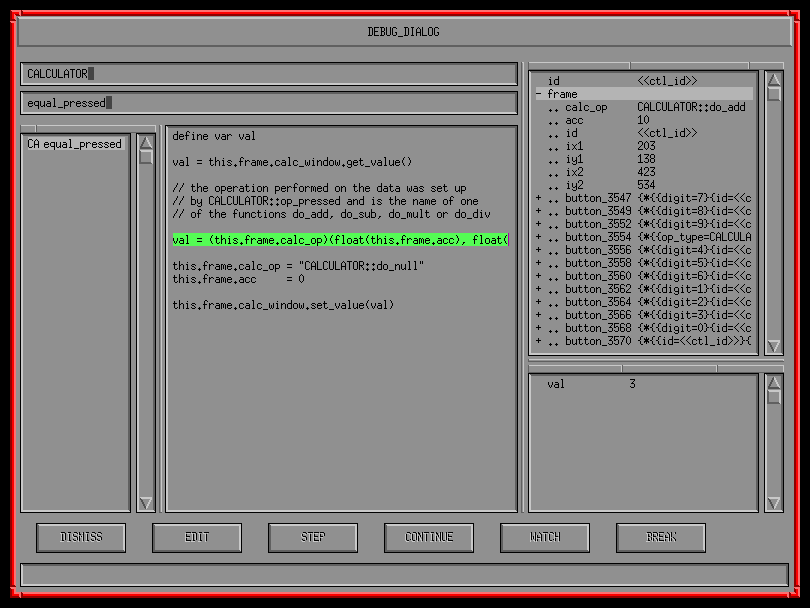
The simplest way to test an XPE function is to bring up the method edit dialog, select the function to be debugged then invoke the debug dialog on it. It is then a simple mater to single step through the function and watch the variables change. Long sections of code can be traced at high speed by using the break point and continue facilities. In this way long loops do not need to be single stepped.
This dialog shows a section of XPE code being interactively debugged
The virtual calculator (including all the XPE code) that is being debugged in the debug dialog shown above is shown here.